
Keyword
Earth Science | Oceans | Ocean Optics | Reflectance
4 record(s)
Type of resources
Topics
Keywords
Contact for the resource
Provided by
Formats
Update frequencies
Status
draft
-
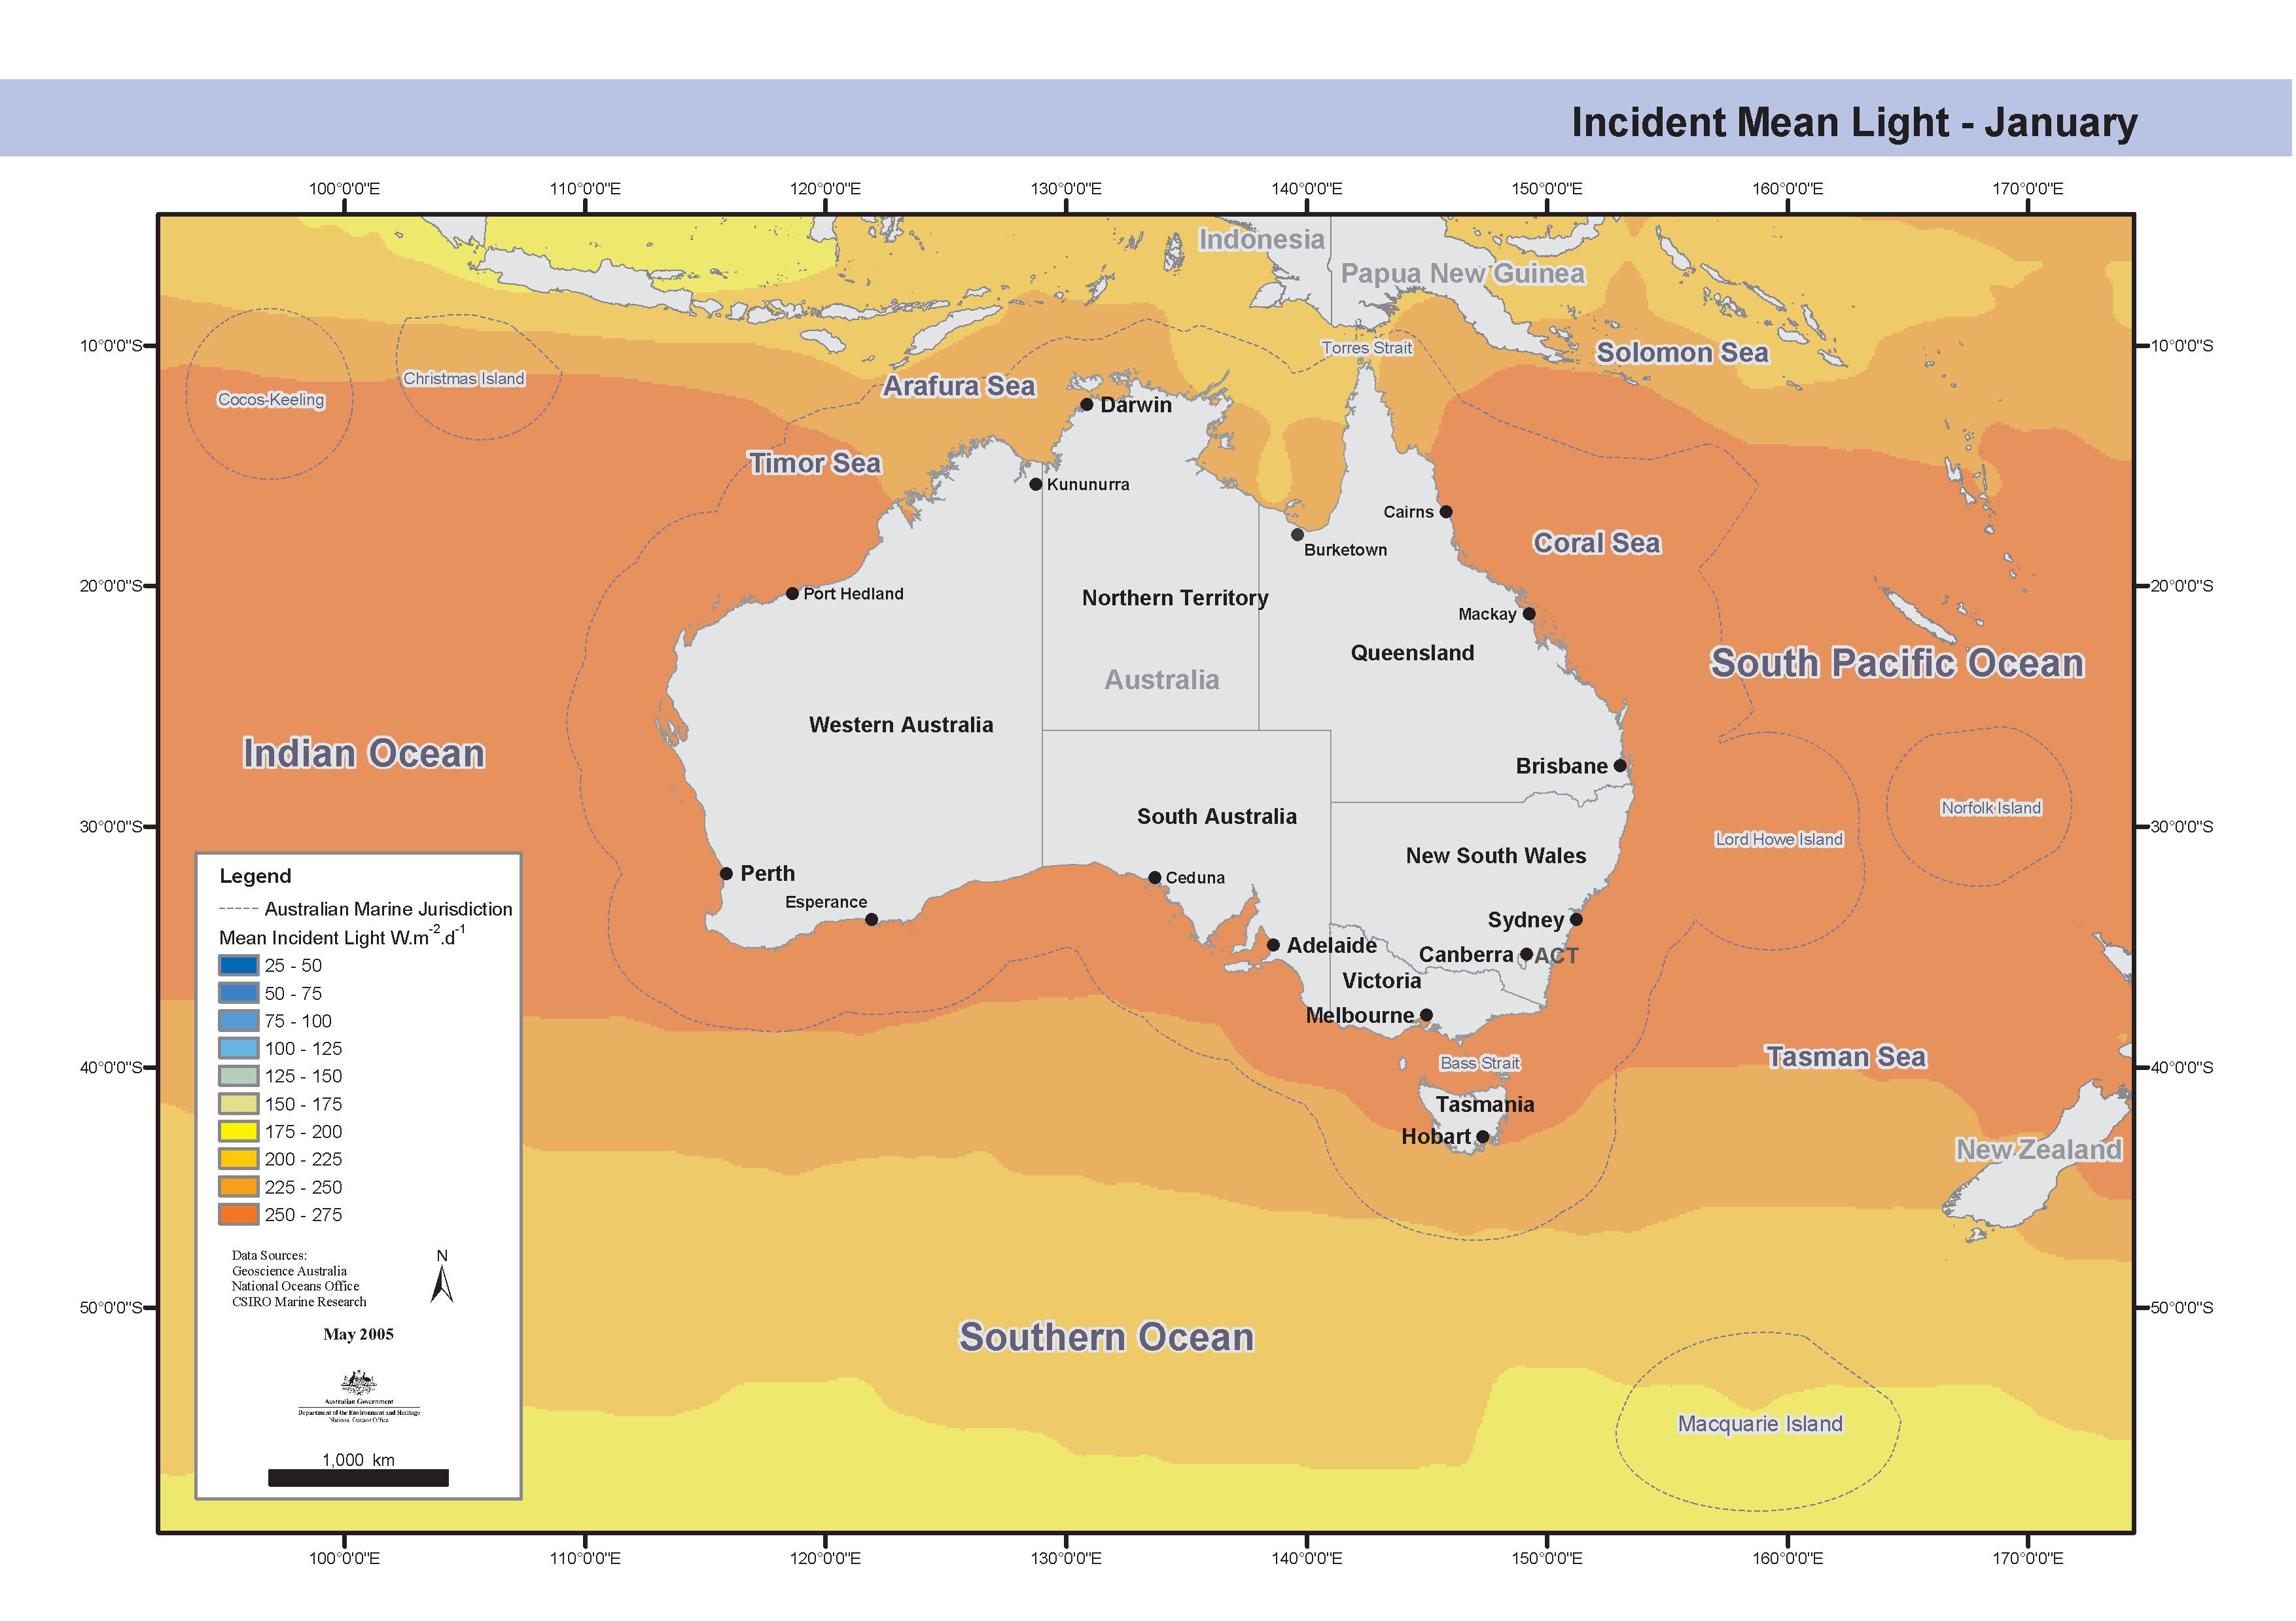
Set of maps showing the mean incident light each quarter around Australia. These maps have been produced by CSIRO for the National Oceans Office, as part of an ongoing commitment to natural resource planning and management through the 'National Marine Bioregionalisation' project.
-
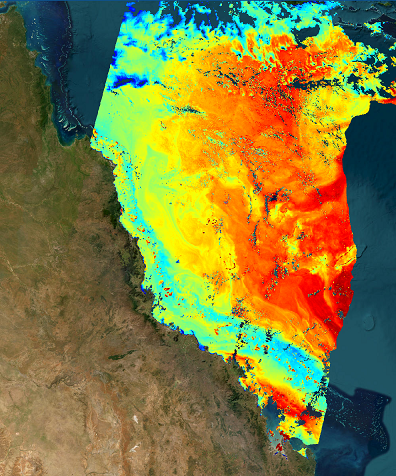
Sentinel-3 OLCI reduced resolution (approximately 1000m-pixel size) daily reprojected Level 2P above-water spectral remote sensing reflectance produced by CSIRO under eReefs Phase 5 using the FUB-CSIRO Coastal Water Processor (detailed description at https://doi.org/10.1016/j.rse.2021.112848). This product was derived from Level 2 geophysical quantities, and placed onto a regular grid using nearest neighbor resampling. Standard Level 1 quality flags have been applied to pre-mask and quality control the data (see file_version_quality_control). Additional algorithm input and output out-of-range flags (in_out_OR_combined_flags) are provided to further quality control the data. These flags have not been applied to pre-mask the data.
-
his movie file consists of a series of 8-day composite, 4 km resolution SeaWiFS surface chlorophyll images for the geographical area bounded by 90°E-180°E, and 10°N to 60°S. The data run from September 1997 until March 2001. Pixels where no usable data has been received are represented in black. A colour bar and calendar are included in the movie. Pixels where no usable data were received are represented by black dots. Accuracy is ± 20%. Each scene was captured as a gif image, and then assembled into a movie by Chris Rathbone, CSIRO Division of Marine Research Remote Sensing Group. The composite images were obtained from http://oceancolor.gsfc.nasa.gov/SeaWiFS/ .
-
This data is the surface solar irradiance data obtained for NASA/GISS to allow the production of photosynthetically active solar irradiance fields to allow the calculation of primary production using satellite ocean colour products. The information comes from the International Satellite Cloud Climatology Project (ISCCP) using C1 data from multiple geostationary and polar orbiting meteorological satellites to provide a global view of the occurrence and properties of clouds. Atmospheric, cloud and surface data from ICSSP are used as input along with a scheme for computing clear-sky irradiance from the solar zenith angle, air properties, and surface reflectance. The scheme then uses simple cloud properties (cloud fraction, cloud optical thickness, and diffuse albedo) to produce total and photosynthetically active solar irradiance fields (Bishop and Rossow 1991; ISCCP Documentation of Cloud Data; Frouin et al. 1989). Input and output data fields are given in a 2.5° latitude and longitude grid. Monthly output data averages have been used for this project.